This is the multi-page printable view of this section. Click here to print.

Return to the regular view of this page.

Investments

Drill down on investments

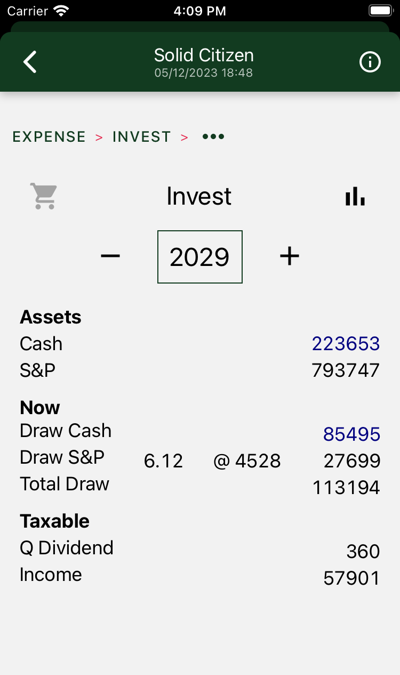
Your assets are divided between after-tax and retirement accounts. Within each account, assets may be held in “cash,” including inflation-protected bonds, or S&P index instruments.

In this year, we draw cash and S&P. Cash draws are denominated in today’s dollars. The S&P withdrawal is denominated in S&P units, or multiples of the S&P average. The dollar figure is an estimate and will vary depending on market performance. Some years you get more, some less.

The draw includes after-tax expenses and estimated tax payment.

Figures at the bottom show tax imputs from your investments.

Charts

Four charts are shown. Swipe to view each in turn.

Drill down further in results to see similar charts for each separate account. Charts on this page show totals across all of your accounts.

Assets
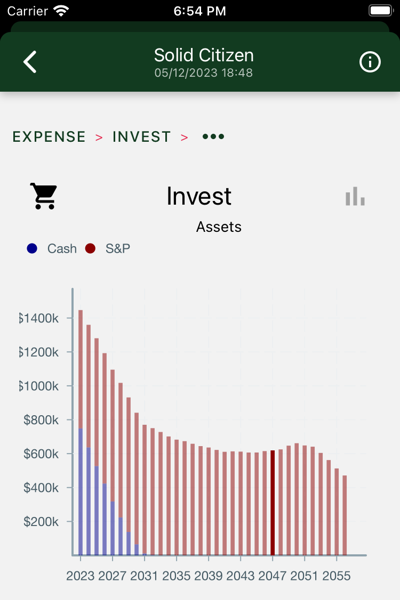
Yearly total account balances, with “cash” and S&P assets highlighted. Cash assets are reserved for the early years, when stock market volatility poses the greatest risk and you don’t have social security to anchor your hedge.

Source of draws
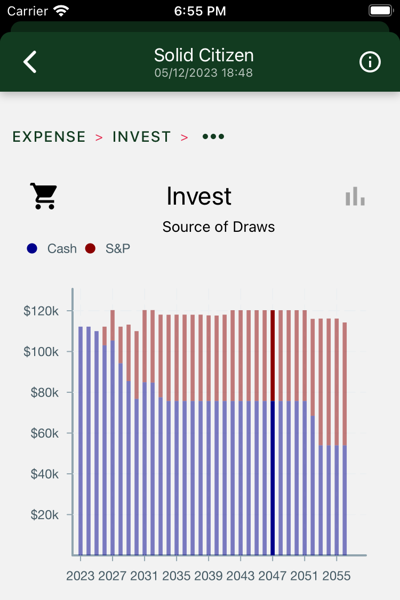
Withdrawals from your investment accounts. Cash assets are consumed first, until the higher expected returns of the stock market catch up to and overtake their expected risk.

Required cash percentage
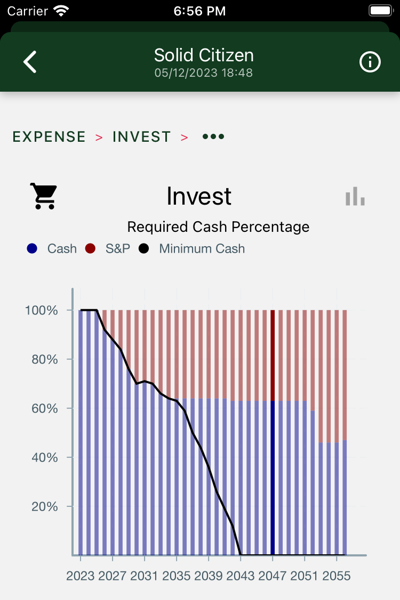
The bars show the percentage of cash assets in each year’s draw. The line shows the required percentage. The bars and line diverge when social security starts, giving you enough cash income to cover your hedge.

Tax inputs
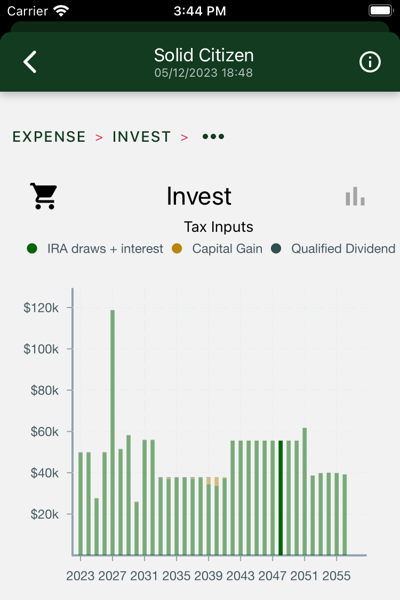
These numbers are entered on your tax return. They come from two sources:

  • After tax account:
    • Ordinary income from bond interest.
    • Imputed ordinary income from bond inflation adjustments
    • Qualified dividends from S&P ETFs. These are reinvested.
    • Capital gain or loss on S&P draws.
  • Traditional IRAs
    • Withdrawals are taxed as ordinary income.
    • Rollovers to Roth accounts are also treated as ordinary income.

In this case, IRA draws are the biggest contributor.
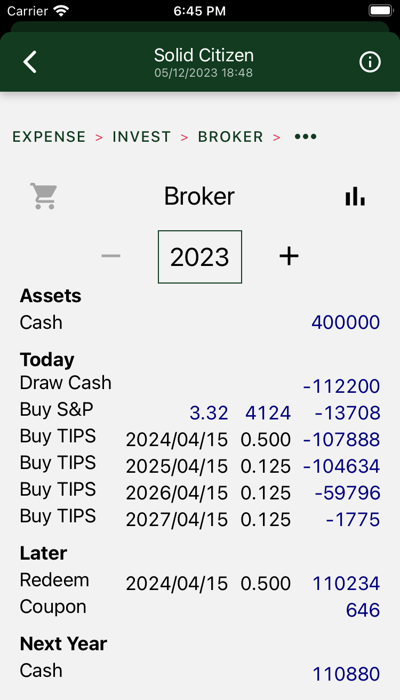
1 - Broker

After-tax account

This is your “broker” or after-tax account.

Required actions are shown for each year. Drill down to see details. The illustration shows the transactions used to set up the portfolio in the first year, in this case, an S&P purchase, and a ladder of TIPS bonds that mature over the first years of the portfolio.

Bond and social security income accrues over the remainder of the year. It is carried over to the next year, where it is typically pulled with the cash draw. (On those occasions where it is not, inflation is charged.)

Charts

Three charts are shown. Swipe to view each in turn.

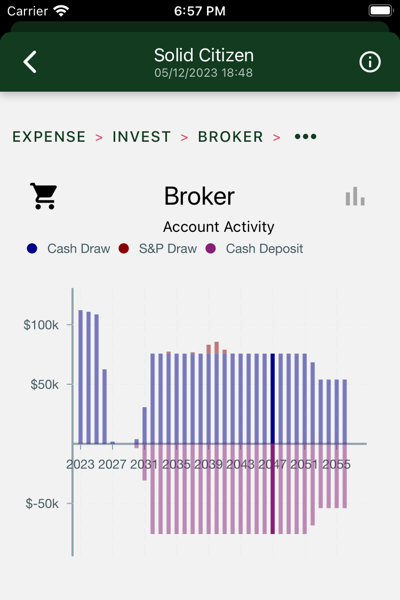
Account Activity

In this chart, we see an initial set of withdrawals used to support us for the first three years. On the right side of the chart we mostly see social security deposits being deposited, then withdrawn to support the succeeding year.

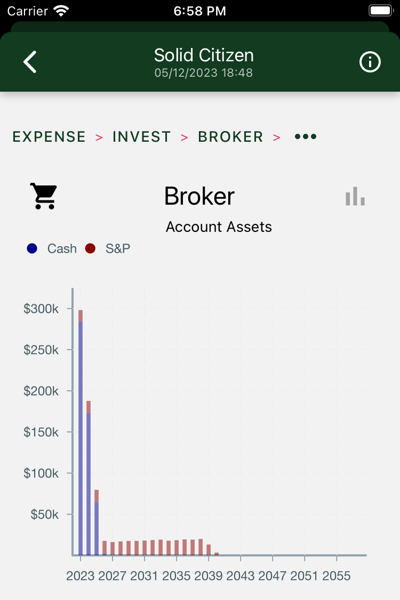
Account Assets

Yearly total account balances, with “cash” and S&P assets highlighted.

Here we see we took our cash and bought some bonds and S&P. The bonds are gone pretty quick. The stock lasts a little longer, but in the remaining years, the account serves only to accumulate income until the start of the next year, when it is flushed.

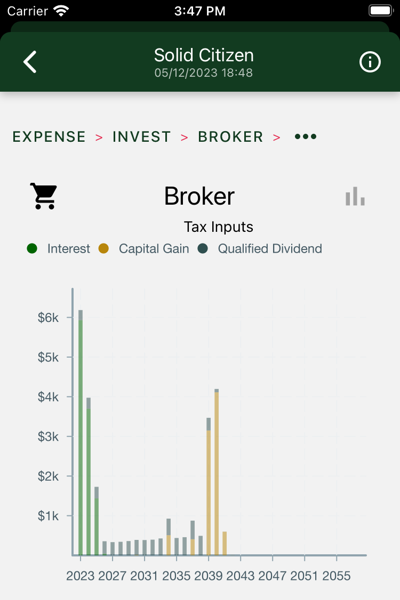
Tax inputs

These numbers are entered on your tax return.

We can see:

  • Bond coupons in the first couple years.
  • S&P dividends over remaining years.
  • Capital gains as S&P portion is liquidated.

2 - IRA

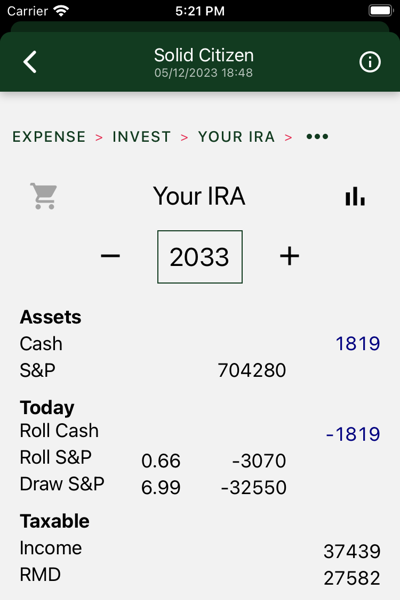
IRA balances and transactions

This is one of your IRA accounts.

After the asset summary, required actions are shown for each year. Drill down to see details. Here we have the required transactions some years after portfolio creation. You might see:

  • Cash draws
  • S&P draws
  • Cash rollovers to Roth
  • S&P rollovers to Roth

At the bottom, taxable income created by withdrawals is listed, along with the RMD, if applicable.

Charts

Three charts are shown. Swipe to view each in turn.

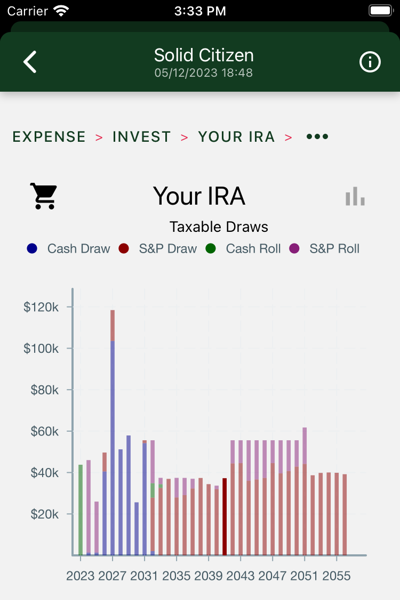
Taxable Draws

Withdrawals from your IRA account. These numbers are taxed as ordinary income. There are two ways to draw from an IRA:

  • A regular distribution is included in your expenses for the year.
  • IRA assets can also be “rolled over” to your Roth account. Pay your taxes on the withdrawal when you roll over, and later withdraw them tax-free from the Roth account. Hedgematic uses this strategy to smooth your tax rates over the entire course of your retirement.

If applicable, required minimum distributions (RMDs) are taken.

Withdrawals and rollovers from cash and S&P are shown separately.

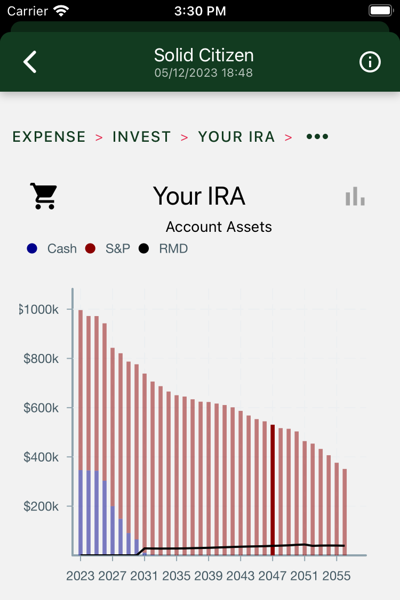
Account Assets

Yearly total account balances, with cash and S&P assets highlighted. The black line shows your required minimum distribution, or RMD.

Here we see we took our cash and bought some bonds and S&P. The bonds are exhausted in a few years. The total balance trends down under pressure from yearly draws and the occasional tax-smoothing Roth roll-over.

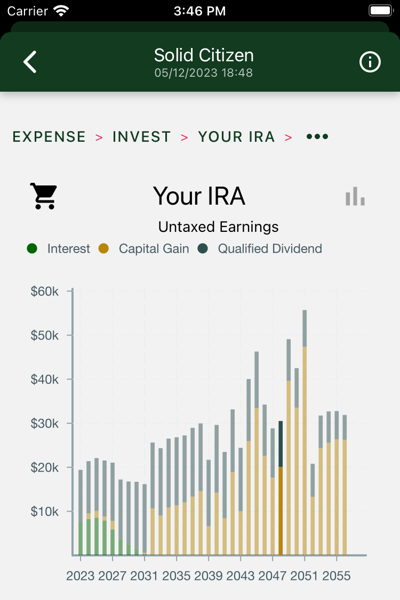
Untaxed Earnings

These numbers are for information only and not entered on your tax return.

We can see:

  • Bond coupons in the first couple years.
  • S&P dividends over remaining years.
  • Capital gains and decreasing dividends as S&P portion is liquidated.

3 - Roth

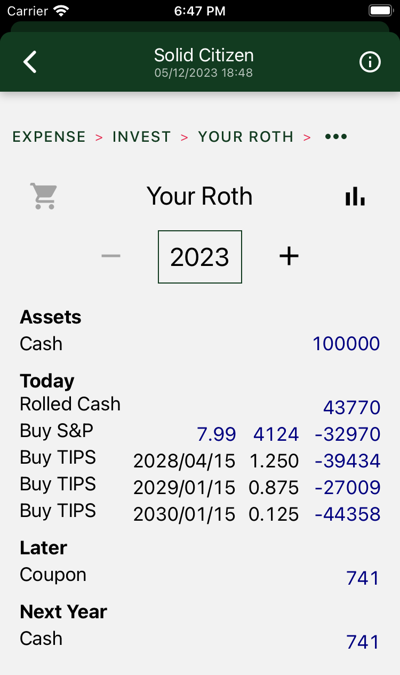
Roth account balances and transactions

This is one of your Roth accounts.

Shown are first year transactions. In this case, we take a rollover from the IRA, then make an S&P purchase, and a ladder of TIPS bonds that mature over the first years of the portfolio.

Charts

Three charts are shown. Swipe to view each in turn.

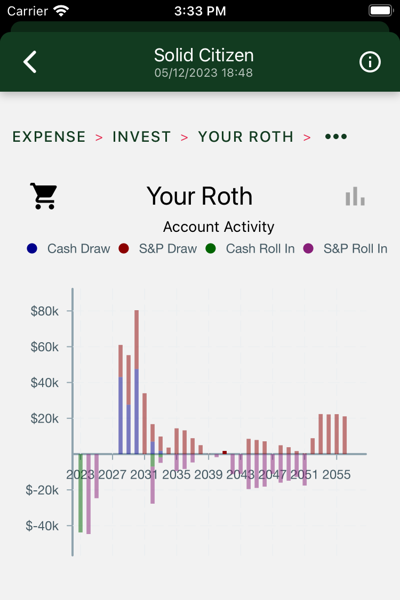
Account Activity

Withdrawals are on top. Roll-ins are on the bottom.

Withdrawals and roll-ins from “cash” and S&P accounts are shown separately.

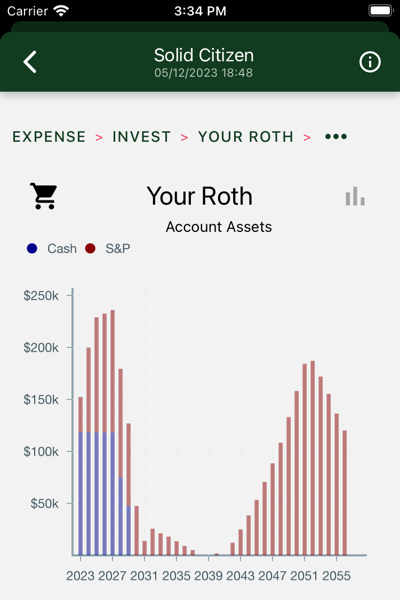
Account Assets

Yearly total account balances, with “cash” and S&P assets highlighted.

In this case, the bulk of the estate migrates to the Roth account as RMDs are just pitched into the Roth account.

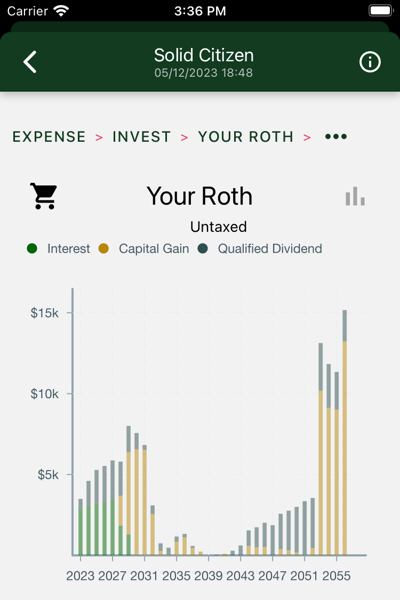
Untaxed Earnings

These numbers are shown solely for amusement purposes.