S&P
The S&P 500 is the oldest, most studied index of stock market performance. Hedgematic uses an S&P ETF to capture stock market income and gains. Your brokerage account and any retirement accounts each may have S&P holdings.
Hedgematic tracks S&P holdings in “S&P units”. Each unit is valued at the current S&P average. Your ETF will be priced differently. When you are directed to buy or sell so many units, multiply by the current S&P and divide by the current ETF to get the number of ETF shares to transact.
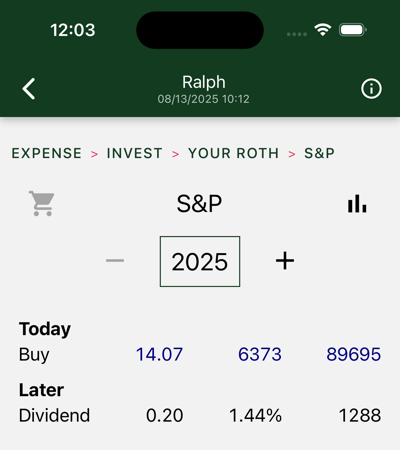
On day 0, inflation adjusted values and actual dollars are the same. In the first year, as displayed here, you have deployed all Roth assets to S&P.
Following the initial purchase, you are not directed to make any additional purchases, with the exception of reinvested dividends. (there are also in-kind rollovers). In effect, your S&P assets are split into individual tranches, each targeted at a particular year and “held to maturity.”
Hedgematic specifies S&P unit withdrawals for each year. You could just uninstall the app and follow the plan, withdrawing your yearly sums. More likely, you will look to rebalance each year.
The dollar figures shown in future years are estimates denominated in today’s dollars, so you should not expect them to match your future sale proceeds. Your proceeds, if you do back out future inflation, may come out higher or lower than the today’s dollar figures shown, which are modeled estimates. Navigate to the Lessons page to learn how this model is constructed and employed.
There is a chance that these proceeds may not meet your specified after-inflation expenses. You indicated your tolerance for this outcome with the risk aversity you included when you created your profile. But there will be a payday every year. Barring national catastrophe, you will not run out of money.
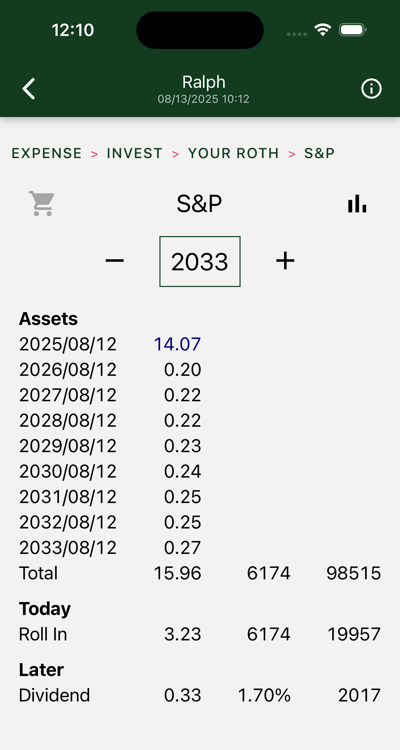
Above is an out-year display.
At the top of the screen, you see you are holding multiple lots of S&P. At the top is your original 14.07 S&Ps. Following you see reinvested dividends for nine years.
In 2033, you are instructed to roll 3.23 S&Ps from your IRA to this Roth.
In later years, you are instructed to sell part or all of particular tranches. Sale proceeds wind up in cash where they are drawn to support your year’s expenses.
Charts
Three charts are shown. Swipe to view each in turn.
Account Assets
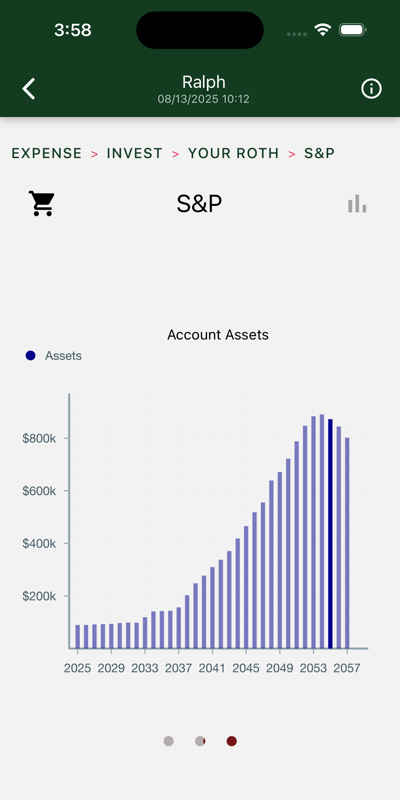
Yearly total account balances.
Account Activity
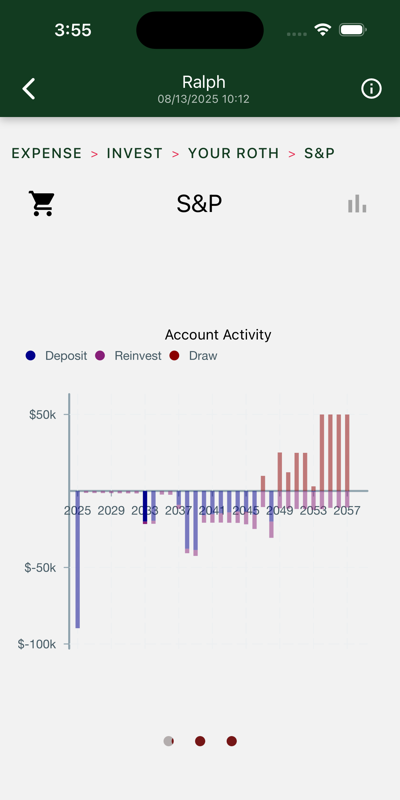
Withdrawals are on top. Initial purchases, reinvestments, and roll-ins are on the bottom.
Tax Inputs
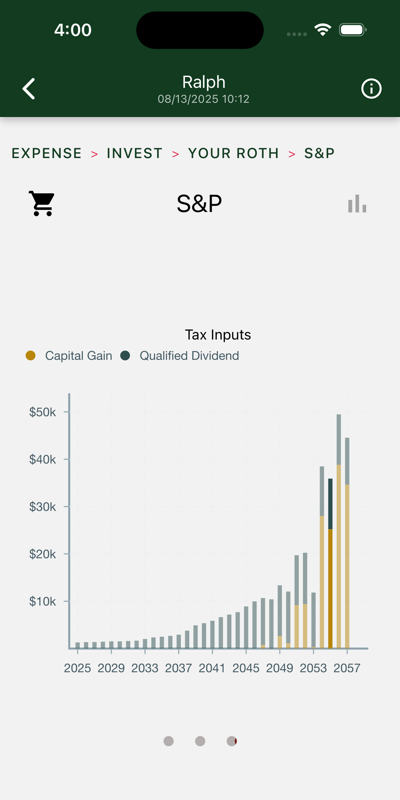
If we are in an after-tax account, these figures show up on your tax return. Otherwise, they are tax-free accumulations.