TRCAPE and S&P Price

What do we see if we model TRCAPE’s effect on future inflation-adjusted S&P prices?
Data
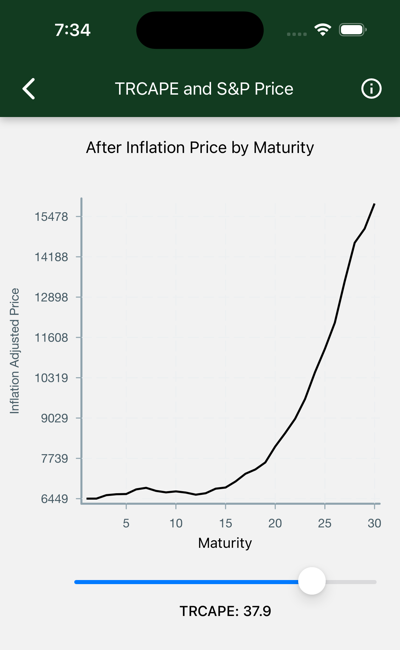
Each point on the black line represents the expected real S&P price at the conclusion of that term. The slider updates the chart for different values of TRCAPE at purchase time.
Maturity appears on the x-axis. This is the number of years an S&P investment is held.
Real S&P Price appears on the y-axis. This is the expected todays-dollar value of the S&P index, given a Term and TRCAPE.
TRCAPE is adjusted with the slider.
Interpretation
The chart is initially displayed for today’s TRCAPE. If you bought the S&P today and held it for a particular term, look on the y-axis to find your expected current-dollar S&P index at the end of your term.
- Move the slider to the left to explore the historical effect of low TRCAPE values.
- In the short term, low values of TRCAPE historically are associated with a steady increase in the S&P index.
- Move the slider to the right to explore the historical effect of high TRCAPE values.
- The index is flat for the first few years, indicating an S&P that just keeps up with inflation.
In the illustrated case, we see current dollar prices basically flat until some 15 years has passed. The nominal price will appear to go up, but those gains are not enough to compensate for expected inflation and the real yield available on inflation adjusted instruments.