Suppose you are plotting an investment to mature in ten years. How do you structure it to keep your risk constant, even though future expected S&P returns will vary from year to year? Vary the proportion of S&P and TIPS holdings.
Data
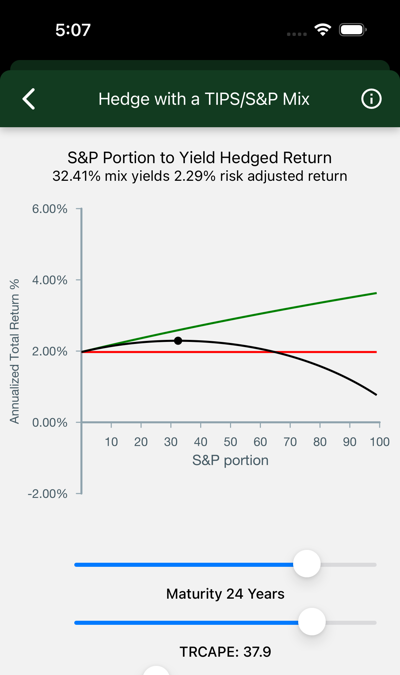
The chart shows expected annualized total after-inflation return of a fixed-term S&P/TIPS mix, with S&P content ranging from 0 to 100%. Use the sliders to see the effect of changes in starting assumptions: term, aversity, and TR CAPE.
-
Annualized Total Return % appears on the y-axis. This is the expected annualized total after-inflation return of an S&P/TIPS mix.
-
S&P Portion appears on the x-axis. This is the percentage of an S&P/TIPS mix which is placed in the S&P, with the remainder in TIPS bonds.
-
Expected S&P return is shown by the top (green) line. It tops out at the expected return of a 100% S&P portfolio.
-
TIPS yield is the horizontal (red) line. It shows the return on a TIPS investment with the selected maturity.
-
Risk Adjusted Return This line (black) charts the risk adjusted return for mixtures of between 0 and 100%. The dot marks its maximum.
-
Maturity is the term of your hybrid investment.
-
Aversity 1 is the default. A value of .5 has the effect of hedging against loss rather than achieving the maximum risk adjusted return. Numbers higher than 1 will increase the cash contribution.
-
TRCAPE will have an effect on these predictions.
Interpretation
- The S&P portion rises as maturity lengthens.
- Short-term S&P volatility dominates. If you want your money back in a year you will not put it in the market.
- Long-term, it is very unlikely that the S&P will not beat TIPS. The lines never cross. A 100% allocation is called for.
- Trade increased returns for higher risk using the aversity slider.
- Even at large values for aversity you are going to include S%P in your portfolio as maturities lengthen.
- Current valuations, measured by TR CAPE, have historically had a noticeable effect on performance, and hence, on these predictions. See this effect by trying high and low TR CAPE values.
Using this tool you can essentially design a custom instrument that pays off after a fixed term, with risk and return balanced to your preference. Buy it and hold it long, without attending to daily ups and downs in the market.
Background
The data displayed on this page is modeled based on data sourced from U.S. Stock Markets 1871-Present and CAPE Ratio.