TRCAPE and Reinvested S&P Earnings
What do we see if we model TRCAPE’s effect on future on future reinvested inflation-adjusted S&P returns?
Data
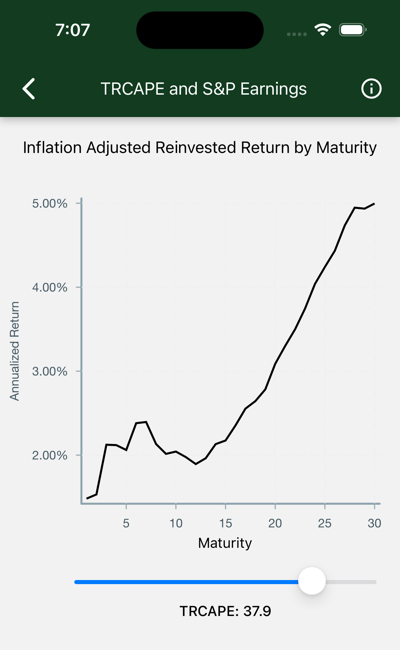
Each point on the black line represents the expected annualized real S&P return on a purchase held for a given term. The slider updates the chart for different values of TRCAPE at purchase time.
Maturity appears on the x-axis. This is the number of years an S&P investment is held. As the term increases, returns draw closer to the historical rate of around six percent after inflation.
Annualized Real S&P Return appears on the y-axis. This is the expected annualized total after-inflation return of an S&P investment, including reinvested dividends, given a Term and TRCAPE.
TRCAPE is adjusted with the slider.
Interpretation
The chart is initially displayed for today’s TRCAPE. Look on the y-axis to find your expected annualized return for 30 maturities.
- Move the slider to the left to explore the historical effect of low TRCAPE values. In the short term, returns are higher than long-term values. Long returns approach historical long-term results.
- Move the slider to the right to explore the historical effect of high TRCAPE values. In the illustrated case, we see real returns hovering around 2% until some 15 years has passed. These returns might be higher than those available on TIPS bonds, but not by enough to mitigate the additional risk imposed by stock market volatility.